How I Try to Stay on Track with My Fitness Goals: Building a Garmin Data Tracker
The Challenge: When Your Fitness App Needs a Boost
As a software developer with a passion for fitness, I've always been fascinated by the intersection of technology and personal health. Like many people, I struggle with consistency in my fitness routine. I have a Garmin watch that tracks my activities, but I found the standard app lacking in motivation and goal-setting features. I needed something more engaging and personalized.
The Solution: A Custom Garmin Data Tracker
To address this, I decided to create my own fitness tracking app. Here's how I approached it:
Backend (AWS Lambda) - The Data Processing Engine
I created a Python Lambda function that connects to the Garmin API using the garth library. Here's a snippet of how it fetches and processes activities:
def fetch_and_process_activities(start_date, end_date):
    print(f'Fetching activities from {start_date} to {end_date}')
    activities = garth.connectapi(
        "/activitylist-service/activities/search/activities",
        params={"startDate": start_date, "endDate": end_date}
    )

    total_km = 0
    for activity in activities:
        activity_type = activity['activityType']['typeKey']
        if activity_type in ['walking', 'running', 'treadmill_running', 'hiking']:
            distance_km = activity['distance'] / 1000  # Convert meters to kilometers
            total_km += distance_km
            print(f"Added {distance_km:.2f} km from {activity_type} activity on {activity['startTimeLocal']}.")

    print(f"Total distance for specified range: {total_km:.2f} km.")
    return total_km
This function fetches activities for a given date range and calculates the total distance for walking, running, and hiking activities.
Frontend (Flutter) - Visualizing Progress
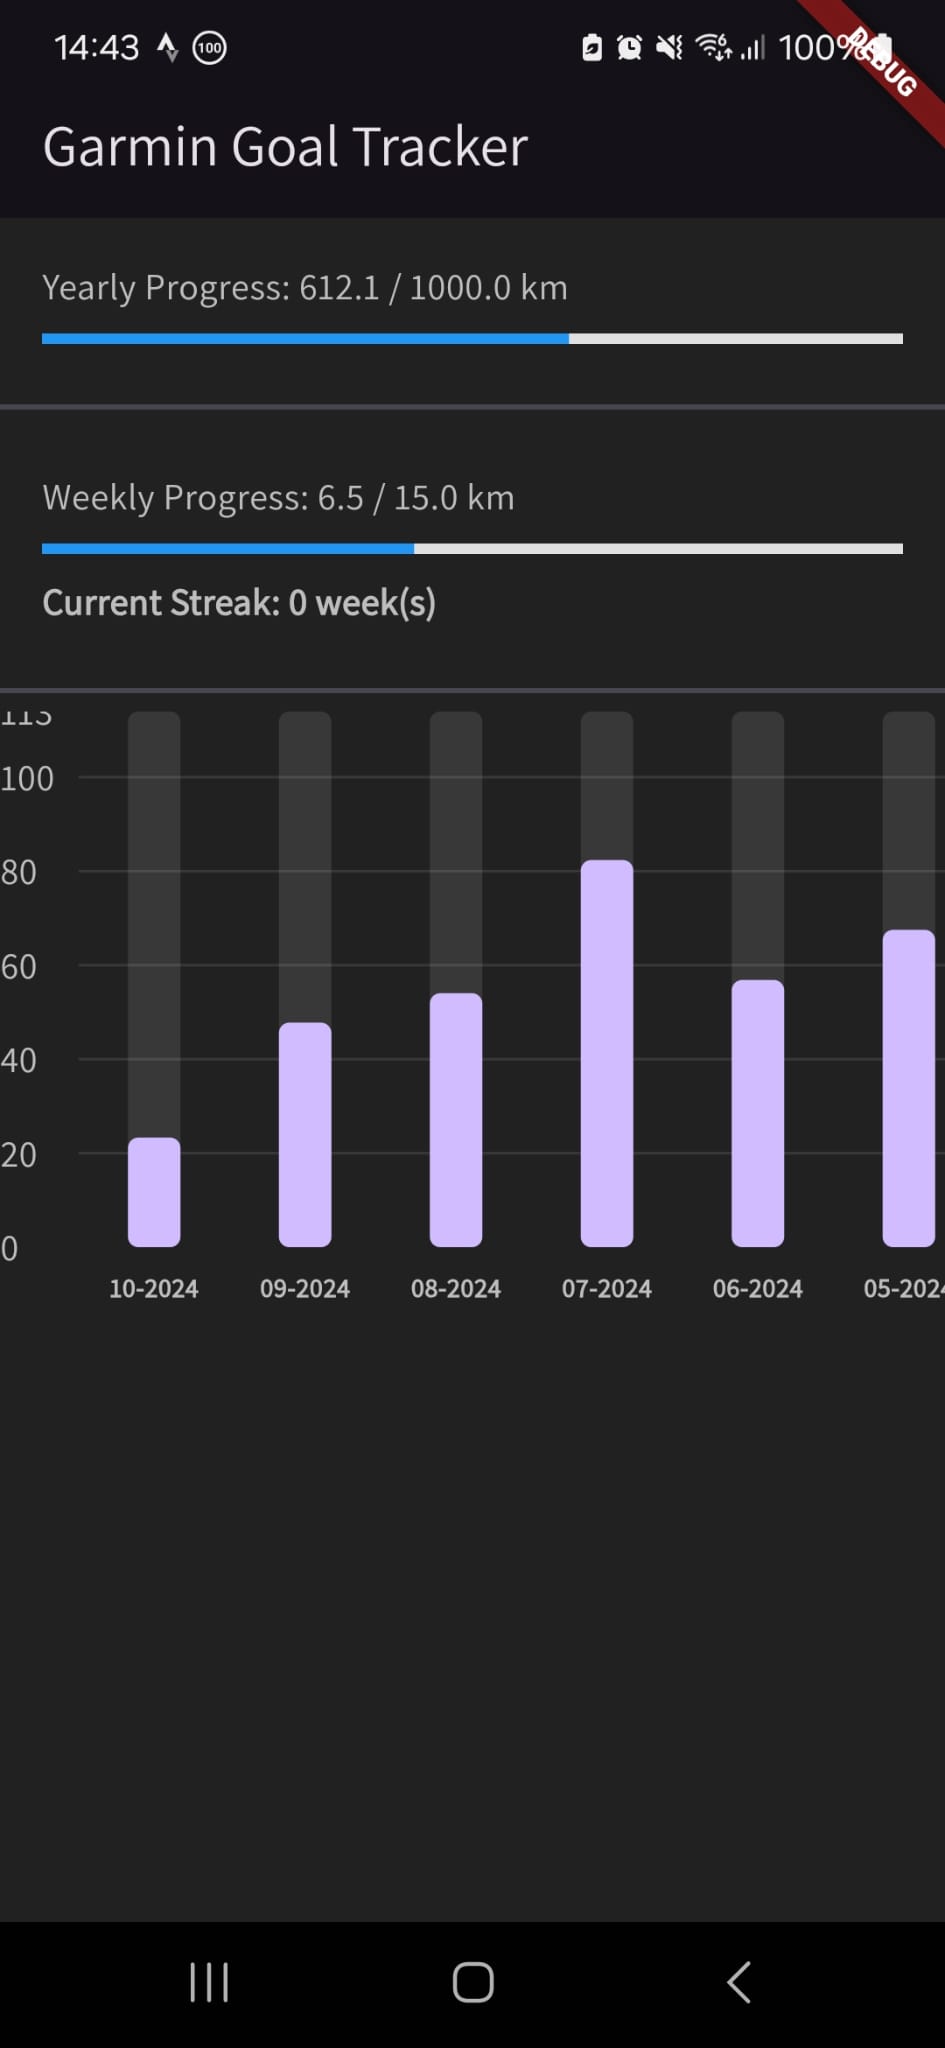
I built a Flutter app that communicates with my AWS backend to display my Garmin data. One of the key features is a chart showing my monthly activity. Here's a snippet of how I created this chart:
class KilometersChart extends StatelessWidget {
  final List data;

  const KilometersChart(this.data, {Key? key}) : super(key: key);

  @override
  Widget build(BuildContext context) {
    return AspectRatio(
      aspectRatio: 1.7,
      child: BarChart(
        BarChartData(
          alignment: BarChartAlignment.spaceAround,
          maxY: data.map((e) => e.km).reduce((a, b) => a > b ? a : b) * 1.2,
          barTouchData: BarTouchData(
            touchTooltipData: BarTouchTooltipData(
              getTooltipItem: (group, groupIndex, rod, rodIndex) {
                return BarTooltipItem(
                  '${data[groupIndex].month}\n',
                  TextStyle(color: Colors.white, fontWeight: FontWeight.bold),
                  children: [
                    TextSpan(
                      text: '${rod.toY.toStringAsFixed(1)} km',
                      style: const TextStyle(
                        color: Colors.yellow,
                        fontSize: 16,
                        fontWeight: FontWeight.w500,
                      ),
                    ),
                  ],
                );
              },
            ),
          ),
          titlesData: FlTitlesData(
            // ... (title configuration)
          ),
          borderData: FlBorderData(show: false),
          barGroups: data.asMap().entries.map((entry) {
            return BarChartGroupData(
              x: entry.key,
              barRods: [
                BarChartRodData(
                  toY: entry.value.km,
                  color: Theme.of(context).primaryColor,
                  width: 22,
                  borderRadius: const BorderRadius.only(
                    topLeft: Radius.circular(6),
                    topRight: Radius.circular(6),
                  ),
                ),
              ],
            );
          }).toList(),
        ),
      ),
    );
  }
}
This chart provides a clear visual representation of my monthly kilometers, helping me track my progress over time.
Key Features
- Yearly Goal Tracking: I set an ambitious goal of 1000km per year, which includes hiking, walking, treadmill, and running activities. The app helps me visualize my progress towards this annual target.
- Weekly Streak System: To keep myself consistently active, I implemented a streak system. Each week, I aim to reach a distance goal. If I succeed, the goal increases by 10% for the next week. If I miss the target, it resets to my original 15km goal. This gamification adds an extra layer of motivation to my routine.
- Monthly Activity Visualization: The bar chart gives me a quick overview of my monthly performance, making it easy to spot trends and areas for improvement.
The Impact: Progress in Motion
Since implementing this system, I've noticed several positive changes:
- Increased Awareness: I'm now more conscious of my activity levels on a daily and weekly basis.
- Goal-Oriented Mindset: The yearly and weekly goals give me clear targets to work towards, helping me stay focused on my fitness journey.
- Motivation Boost: Seeing my progress visually represented is incredibly motivating, especially on days when I'm tempted to skip a workout.
- Data-Driven Decisions: I can now make more informed decisions about my training based on trends in my data.
Technical Challenges and Learnings
Building this project wasn't without its challenges. Some key learnings include:
- API Integration: Garmin doesn't provide public API access, so I had to use the garth library as a workaround. This required some creative problem-solving.
- Activity Type Categorization: Garmin offers a wide variety of activity types. Deciding which ones to include in my distance calculations and how to categorize them took some consideration.
- Time-Based Calculations: Calculating yearly and monthly totals was more complex than initially expected, especially when dealing with different time zones and date boundaries.
- Data Fetching Limitations: Due to API constraints, I couldn't fetch a full year of data at once. I had to implement a pagination system to retrieve data in smaller chunks.
Future Enhancements
While the current version of my Garmin data tracker is functional, I have several ideas for future improvements:
- Implement machine learning to predict future performance based on past data.
- Add social features to compare progress with friends, adding a friendly competitive element.
Conclusion: A Step in the Right Direction
Building this Garmin data tracker has been an exciting journey that combines my love for coding with my passion for fitness. It's a testament to how personal projects can not only improve our technical skills but also positively impact our daily lives.
While it hasn't transformed me into a fitness guru overnight, it has certainly helped me move more consistently. The app provides the extra motivation I need to lace up my running shoes, even on days when the couch looks particularly inviting.
Remember, the key to achieving fitness goals often lies in consistency, awareness, and finding what works for you. Whether you build your own tracker or use existing tools, find a way to keep your goals visible and measure your progress. After all, every step counts!
Note: This project is for personal use and educational purposes. Always ensure you comply with the terms of service of any APIs you're using, and never share your personal credentials in your code.
